Tracking your SEO with Google Analytics: a how-to

At Yoast, we’re known for giving you numerous tips to improve your site’s SEO. However, how do you know whether those tips are actually working for you? There are a number of tools out there that can help you track your SEO, but most of them will cost you money. And, in the end, it’s obviously just about increasing your website’s traffic. There’s this great free tool that gives a lot of insight into how your website’s traffic is doing: Google Analytics! Almost everyone uses it – but perhaps not to its full potential. That’s why, in this post, I’ll explain how to keep track of your SEO using Google Analytics.
I’ll give you a step by step instruction on how to find the data that will help you track your SEO using Google Analytics. The videos in this post (without sound so you can watch them everywhere) show you exactly which steps to take. Please note that the post is quite long, but hey! It’s about your SEO, so it’s probably worth your while.
Pro tip:Want to check your site stats without becoming a technical expert? Check out our post about the Google Site Kit plugin!
Tracking your overall SEO
One of the first indications of how your website’s SEO is doing is looking at the amount of traffic coming to your website. In Google Analytics, you can find an overview of your traffic in the Audience section. This tells you how many sessions there were on your website in a given time period.
However, this doesn’t tell you which part of that traffic results from your SEO efforts. It just shows you all traffic to your site. To find the traffic that’s coming directly from search engines (called ‘organic’ in Google Analytics), you’ll need to go somewhere else. These steps are all taken in the video below. If you go to Acquisition > All Traffic, you’ll see a list of sources where your traffic comes from. Usually, the traffic from search engines (more specifically, Google) is somewhere to be found in the top 3. Find the search engines you want to know the volume of traffic for – recognizable as medium=organic – and select those checkboxes. If you hit “Plot Rows” after that, you’ll get a nice graph showing you the total traffic and lines in other colors for the sources you’ve selected.
If you want a view that’s a bit more precise, you can click the pie chart icon to see exact numbers and percentages of the total. And if you want to see all the organic traffic combined into one, simply click the medium tab. Of course, you can again plot the row for the line graph here as well.
Unfortunately, the organic keyword tab that’s listed under the campaign tab doesn’t do much anymore nowadays. Apart from showing (not set) it just shows you where people end up and doesn’t provide many keywords (np = not provided).
What does organic traffic say about my SEO?
Now you know what to look at in Google Analytics to see how much traffic you’re getting from search engines. If you’re not getting a lot of traffic from search engines, then that tells you that you need to work on your SEO. There’s a lot of potential traffic you may be missing out!
If you notice the number of organic traffic is declining, then you need to work on your SEO as well. Especially if the decline is large. Perhaps you’ve got a crawlability or another technical SEO issue. If the decrease is drastic, all alarm bells should go off. Dive into your Google Search Console and check if you can find what’s causing the decline.
If you’re noticing an increase in organic traffic, well done! Think about what you’ve been doing lately that might have caused this increase. You want to know these kinds of things because it’ll help you understand your SEO better.
The above only tells you how your overall SEO is doing. However, most times, you’d want to focus on something more specific than your entire site. You’d want to focus on a specific page or post.
Page-specific SEO monitoring
If you want to see your analytics at a per page level, you have to go to Behavior > Site Content > Landingpages. Here you’ll see your site’s top 10 landingpages, ranked on the number of sessions. If you have a specific page you want to look at, you can simply fill in the URL (without the domain name) in the search bar. You’ll now be able to see that page’s data. However, these are still all the sessions, not specified to traffic coming from search engines. To find the traffic originating from search engines, there are two ways to go.
The first one is via filtering the data in the table: you have to click the “Secondary dimension” drop-down and click Acquisition > Medium. Additionally, you can click Source/Medium if you want to specify per search engine. Clicking the checkbox for “Organic” medium and hitting “Plot Rows” again, will give you the line graph for your total and organic traffic. It’ll also show you other traffic sources, which is always interesting.
Again, if you want a more specific view, click on the pie chart icon. Comparing the percentages of organic traffic for your specific page to your total organic traffic can also give you a good idea of how your page is doing. And ideally, you’d want to see a line that’s moving up (or at least not downward).
Tip: To make the data even clearer, you can add another filter (using the search bar) to only include medium containing “Organic.” This will give you just the organic traffic data for every page.
The second way to go is creating a segment that only includes ‘Organic traffic.’ I absolutely adore segments, because it makes Google Analytics so much easier to use. You can read more about my love for segments in the ‘Why use segments in Google Analytics‘ post. Google Analytics offers you a ready-made segment called ‘Organic traffic.’ Choose that segment from the list, and voila, you’ll only see traffic coming from search engines. Now you can analyze all pages in the Behavior section and check if you see an upward trend (or not).
Obviously, everything I mentioned here is related to monitoring your SEO and not actually finding issues that might be related to your SEO. To find possible issues we always look at a lot of things, a few of which I’ll explain now. These things will help you find issues that might be related to your SEO.
Google Analytics and Google Search Console
Google Analytics offers a way to integrate Google Search Console with your Google Analytics data. And that’s awesome because now you can combine the metrics of these two tools together.
Google is replacing the current Universal Analytics with Google Analytics 4 in 2023. Check out our post about how to prepare for Google Analytics 4
First thing you need to do is add Google Search Console to your Google Analytics account. Before you can do this, you need a Google Search Console account which you can easily set up with our plugin. If you have an account, go to the Admin section in Google Analytics at Property level and look for All products in the Product linking section. In the video below is explained how to make the connection.
Once connected it needs a bit of time before you see actual Google Search Console data in your Google Analytics reports. But when there’s data, there’s magic! You can find this magic under Acquisition, there’s a Google Search Console section with landing pages, queries, countries and devices. I find the landing pages report especially interesting:
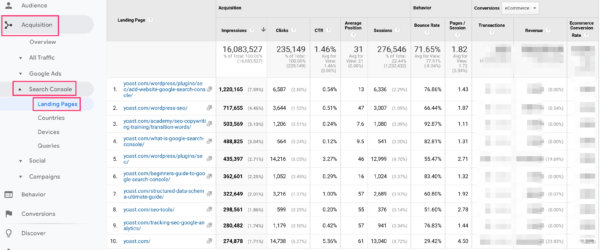
First of all you can see which landing pages have most impressions and so but that’s information you can see in just Google Search Console of course. The added benefit for having this data in Google Analytics is that you can also see metrics from Google Analytics. Like bounce rate, conversion rate and transactions (if you have an online shop). Here you can find if there’s a relation between Click Through Rate (CTR) and Bounce rate. Do landing pages with a high CTR have a low bounce rate? Or do they have a high bounce rate? If that’s the case then you immediately have something you can take action upon. Another example, if you see that a page has a reasonably high conversion rate but a bit of a poor ranking, that it’s worth your while to put some more SEO effort into that page.
Bounce rate
If you click on Behavior > Site Content > Landing Pages, you’ll get a list of pages through which people enter your site. Landing pages are important because they’re the first thing your visitors will see. They are literally pages that people land on coming from a traffic source. An important metric on this screen is the ‘Bounce Rate.’ This metric gives you the percentage of people that left your landing page without having done anything on that page. And although Google doesn’t take the Google Analytics bounce rate into account as a ranking factor, it does look at how quick people hit the back button and return to the search results page. So you want visitors to spend more time on your pages and, preferably, even engage with your site.
To get a good idea of which pages have a high bounce rate, click the Comparison icon. In the last column, select bounce rate. This will give the bounce rate compared to the site average for all your pages starting from the most visited page. Any page that has a red bar is below your site’s average bounce rate. Anywhere between 0-10% in red is basically fine, but anything above 20-30% should definitely be looked at. Especially, if it concerns pages in the top 10.
The bounce rate is important because it tells you something about the quality of your traffic and/or the quality of the page. It has an indirect influence on your SEO. If people quickly jump back to the search results after a glimpse on your page, that means they probably haven’t found what they’re looking for. Google takes this to mean your page isn’t relevant enough for the keyword the person has searched for, and rightfully so.
Read more: Understanding bounce rate in Google Analytics »
Internal site search
If you click on Behavior > Site Search > Overview, you’ll find a list of search terms people have searched for on your site, using your site’s search. This is always a good dataset to keep track of as well since it can give you a good idea of what your audience expects to find on your site. If there are any search terms there that you haven’t created a page for yet, it’s probably a good idea to try and fit a page on that subject in. Plus, it gives great insight into the words people are using. Do they match the keywords you’re using?
Obviously, you do need to have your Site Search set up the right way. You have to enable site search and fill in the right query string for searches. You can check this Google Analytics documentation for more information.
Mobile traffic
Optimizing your site for mobile SEO is crucial, especially since Google’s mobile first indexing. Google will base the rankings of your site on how your mobile site instead of your desktop site. If the user experience and Google’s experience on your mobile site is poor, chances are you rank poorer than website who have a better mobile experience. In Google Analytics there’s information about your mobile traffic.
If you go to Audience > Mobile > Overview, you’ll get a dataset that shows you how many people are entering your site using a desktop, a mobile phone or a tablet. Once again, click on the pie chart icon to get a good view of how many mobile visitors you have. If that’s more than 10%, you should definitely make sure your website looks good and works fine on a mobile phone. Also, if you’re noticing your bounce rate on mobile is significantly higher than on desktop, this can indicate that your mobile site isn’t all that mobile-friendly.
As said before, Google is taking responsiveness of websites more and more seriously and it has become a true ranking factor in mobile search results, so it’s really imperative that you improve your mobile site as much as possible and keep tracking this for your SEO.
Site speed
Next to making sure your mobile SEO is top notch, site speed is a ranking factoras well. Not only is it a ranking factor, it has its impact on conversion and the usability of your site as well. Checking speed performance of your pages and improving it, is a big win for your entire site. Google Analytics has a special Site Speed section which you can find under Behavior > Site Speed. If you click on Page Timings, you can see the Average Page Load Time compared to the site average. Additionally, you’ll get a quick overview of pages that are ‘slow’ so this immediately gives you a to-do list of pages you need to optimize first. There are a couple of site speed tools that can help you with optimizing your site’s speed.
Have I missed anything?
Do you think I’ve missed anything? Or do you have some other great tools you use to track your SEO? Let us know in the comments!
Keep reading: How to prepare yourself for Google Analytics 4 »

Discussion (16)