An introduction to Microsoft Clarity

Microsoft’s Clarity is a new, free analytics tool which provides website usage statistics, session recording, and heatmaps. Compared to Google Analytics (and other analytics platforms), it’s a little basic. But it’s robust, it’s easy to use, and it has some interesting features.
Table of contents
What is Microsoft Clarity?
Clarity records information about users who visit your website, and how they behave. It summarises that information in the form of dashboards, and allows you to explore and highlight interesting segments and behaviours.

It provides basic information on sessions, interactions and engagement, and breaks users down by device type, country and other dimensions. For all of these views, you can explore heatmaps and session recordings. These records might help you to better understand your users and their problems. You might be able to use that insight to improve your website.
You can find out more about Clarity at clarity.microsoft.com, or read on to learn more about its highlights and features.
Key features and reports
Dashboards & metrics
As you might expect from an analytics tool, Clarity provides an extensive overview in the form of a dashboard. This contains all of the usual kinds of metrics you’d expect; session counts, total users, page view details, and similar.
Surprisingly, the dashboard lacks some of the metrics you might expect in a tool like this. There’s no ‘bounce rate’, no ‘conversation rate’, and none of the kinds of tables you might be used to from tools like Google Analytics. You also can’t compare performance across multiple date ranges or segments.
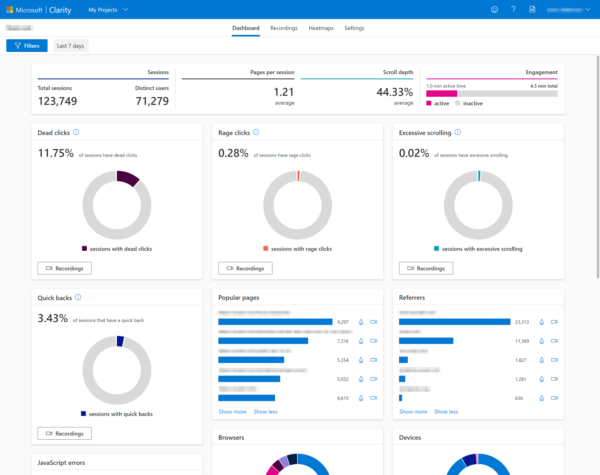
Beyond the usual metrics, Clarity does try to provide some clever insight. Specifically, it tries to identify when users encounter friction. Special reports like ‘rage clicks’ and ‘excessive scrolling’ show users who might have been confused or annoyed. Digging into these can be a great way to find out where your website is letting your users down. Fixing those issues might be a great way to improve engagement, reduce bounce rates, or increase conversions.
Session recording
One of the great attractions of Clarity is that all sessions are recorded. Clarity logs the mouse movements, scrolling, and clicks of every visitor to the site. These can be viewed and replayed at any time in the future. Each of the dashboard panels provides shortcuts to these kinds of video recordings. You can drill down to see recordings from popular pages, from frustrated users, or from specific browsers.
Clickmaps & heatmaps
Most analytics tools do a good job of understanding which pages users navigate to and from. But it’s often much harder to understand how they behave whilst they’re on a specific page.
Clarity’s heatmaps tools record where users click, and allow you to explore and filter this. This kind of view can help you to understand what your users want, and, where your designs and layout might be confusing them.

Clickmaps are split out into desktop, tablet and mobile versions. That lets you explore behaviour by device category.
The functionality here is a little basic, but a future update promises more options. Of note, we’re expecting the addition of scroll maps. These which will visualise the content people see as they scroll down the page, rather than where they click. That’s a different type of data, which can be very useful in helping understand how users navigate.
Filtering & custom tags
To get useful insight, you can use filters to see data with specific criteria. For example, you might want to see session recordings where the user filled out a form, or, see heatmaps from pages where users seem frustrated.
Combining multiple filters can be a great way to dig down into user behaviour, and to find problems to solve.
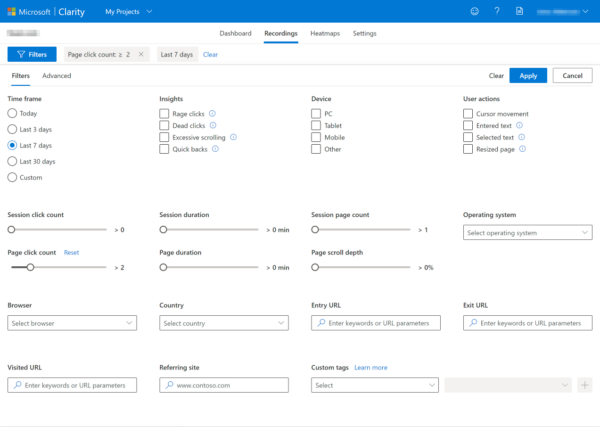
Filtering becomes really powerful when you start using custom tags.
With a little code, you can send extra information to Clarity. That information can be about the page the user is on, the user themselves, the weather, or anything at all. Once you’re firing those tags, you can filter your reports to see metrics, session recordings and heatmaps for sessions and pages where they fired.
Some great use-cases for custom tags include tracking ‘conversion events’ on your website, like when users buy things, register accounts, or fill out forms. Some less obvious, but also useful filters might include tracking whether the user is logged in, or, what type of page they’re looking at.
With that tracking in place, you can filter your dashboards and reports to see how specific users behaved. Unfortunately, there’s no way to compare filtered data (to all data, or to other filtered data). That means that you won’t be able to, for example, compare the ‘conversion rate’ across different custom tags.
You can learn more about how custom tags work, and see example code in Clarity’s ‘Filters’ documentation.
What Clarity isn’t…
It’s clear that Clarity isn’t a comprehensive, all-in-one analytics platform. That’s not a bad thing, though. From our perspective, it even seems like intentional design decision. It’s not trying to be everything. It’s trying to be a session recording tool, heatmapping tool, and ‘user behaviour overview’ tool. And that focus helps it do a good job.
Because of those limitations, you should probably think twice before throwing away all of your other tracking tools. Here’s why:
It isn’t a replacement for Google Analytics
It’s clear that, whilst there are some interesting metrics and reports, Clarity isn’t fully-featured enough to act as your primary analytics tool. That’s especially true if you have a complex site with multiple goals, active marketing campaigns, and lots of moving parts.
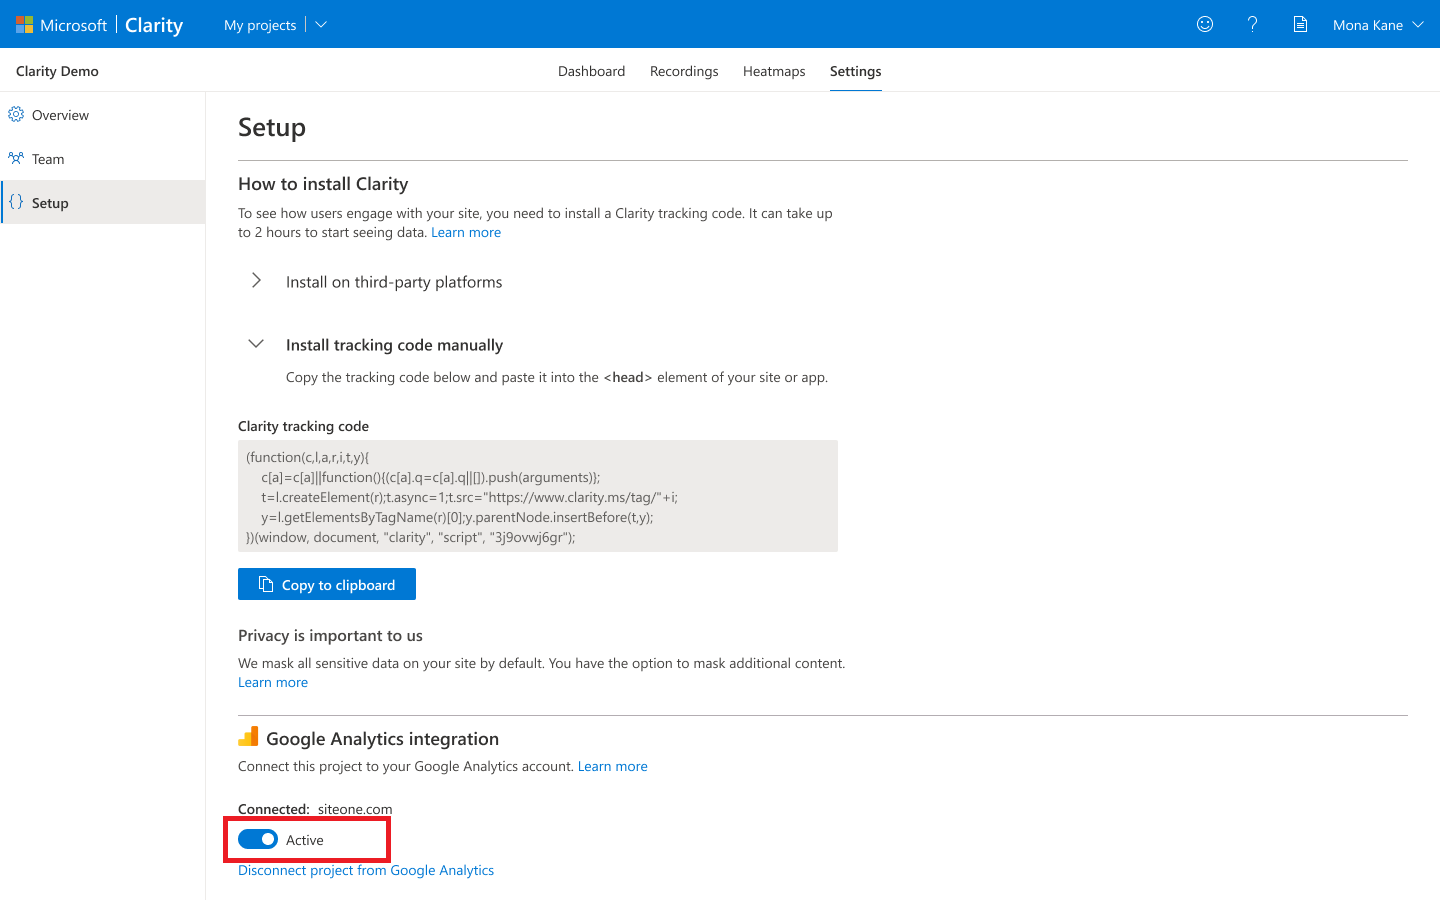
But you can run both tools side-by-side. They even integrate together, with just a few clicks. Once enabled, Clarity passes information back to Google Analytics. That lets you see which Clarity recordings are associated with any of your Google Analytics sessions. That way, you get ‘the best of both’ platforms.
It isn’t a replacement for HotJar
There’s also a lot of overlap between Clarity and industry-leading session recording tool, HotJar. HotJar has been around for a long time, and have built a feature-rich product for session recording, heatmapping, and gathering user feedback.
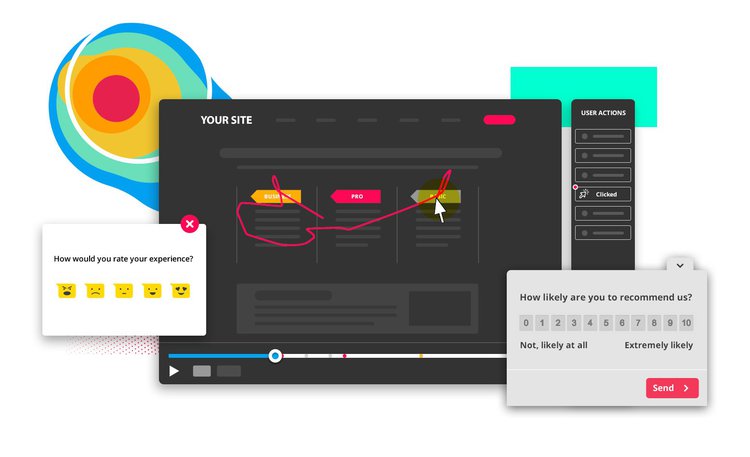
But HotJar doesn’t provide the same kinds of metrics that Clarity does. It lacks an ‘overview’, and doesn’t have Clarity’s clever frustration metrics. We wouldn’t recommend replacing one with the other – in either way around. These are different tools, with different uses.
And again, both of these can be run in parallel. Unfortunately, there’s no easy interface for connecting them. You’ll need to do some custom coding, or use a platform like Google Tag Manager to get them interacting. The way in which HotJar handles custom events and tagging is almost identical to Clarity, so there’s definitely room to apply the same filters and tagging to each.
Installing and configuring Microsoft Clarity
Getting your tracking up and running requires that you sign up to Clarity and create a ‘project’. Once that’s done, you need to get the tracking code onto your website.
At the time of writing, there’s no Clarity WordPress plugin. That means that getting set up requires you to copy-paste the tracking script into your site template, or, use a third-party system like Google Tag Manager to manage it.
Either way, the core Clarity script is very simple – just one block of code to paste into the page, and you’re done. There’s even a walkthrough of the steps (for each approach) in their documentation.
Other considerations
Privacy & consent
You may have noticed in Clarity’s demo video (or if you’ve been playing around with it yourself) that it’s very careful when it comes to hiding sensitive data. Clarity hides the details of lots of content by default, just in case it contains sensitive information.
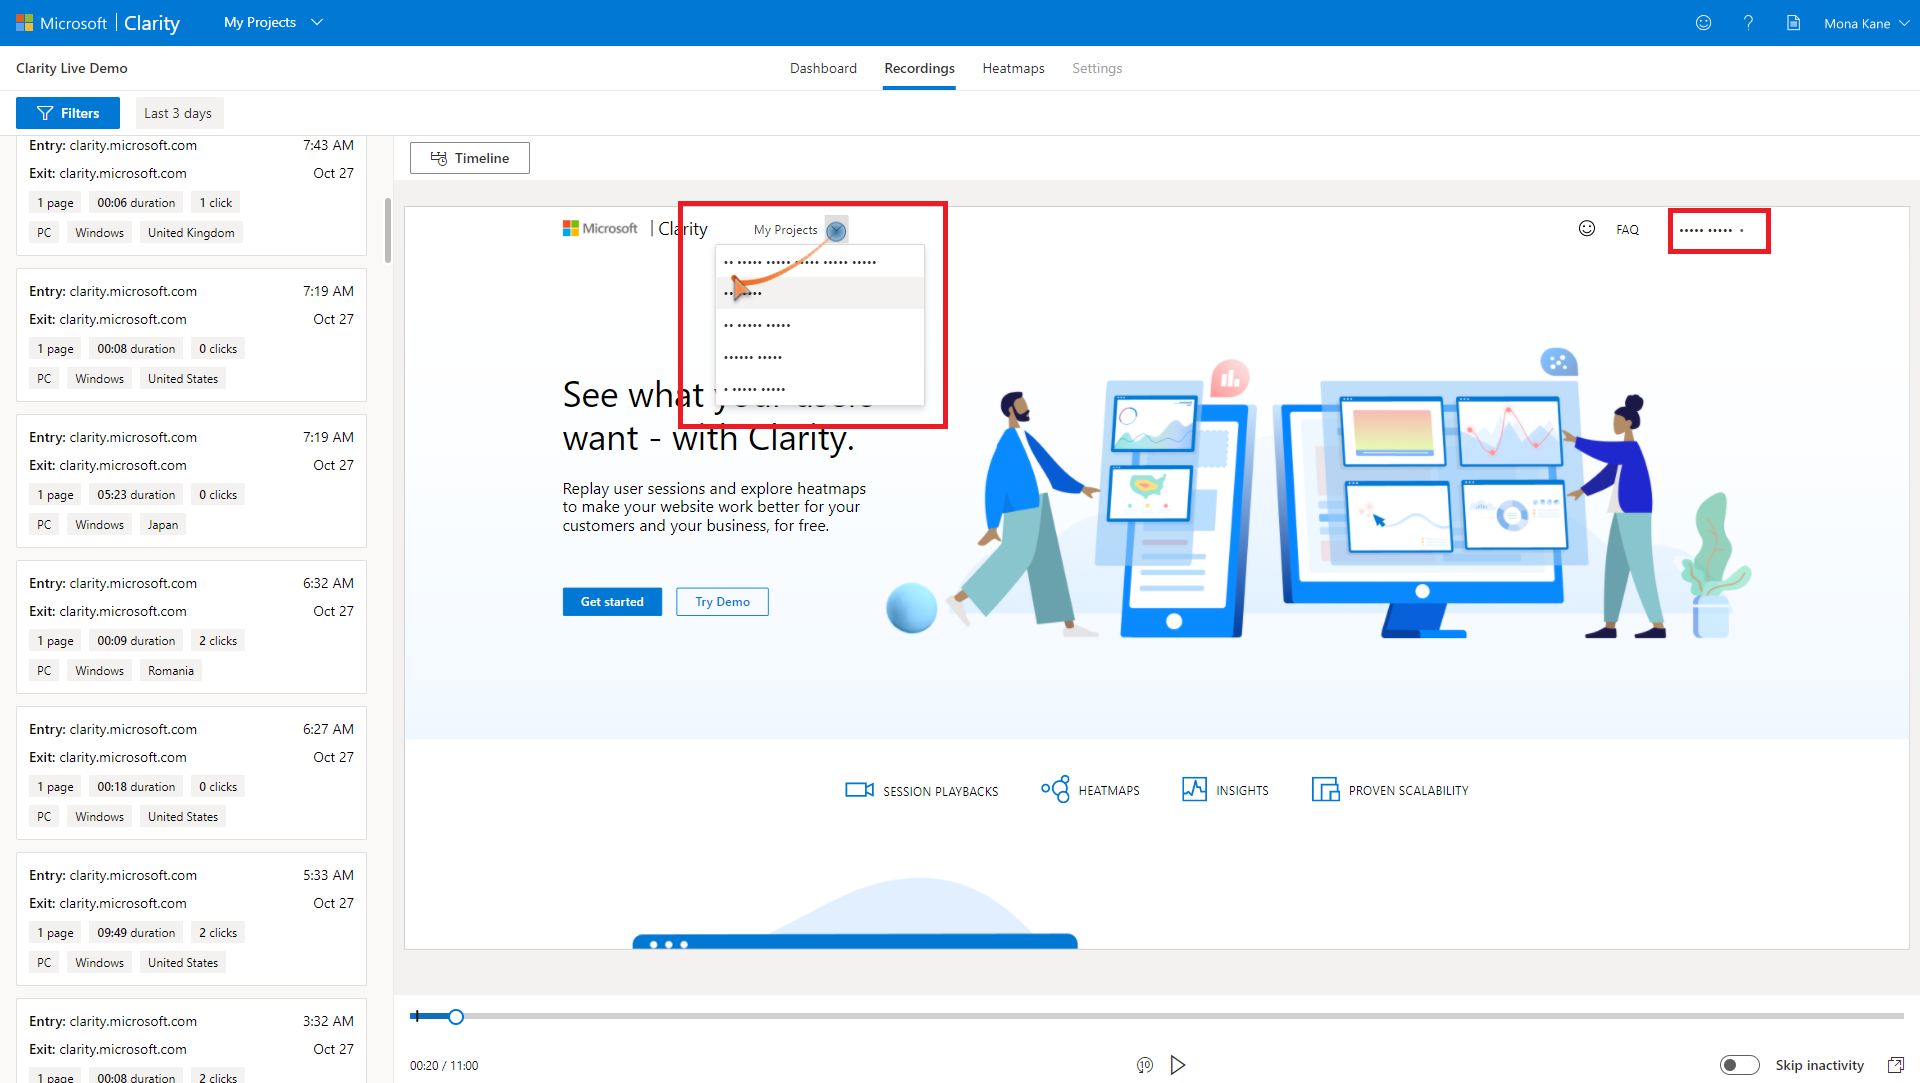
Most numbers, images, form contents and more are automatically hidden in all recordings and heatmaps. That means that you’re very unlikely to accidentally store somebody’s address or credit card details. That’s a good job, because there’s currently no way for users to opt out of this tracking, and, no way to delete individual recordings without deleting your whole account.
If there are specific content areas which are being hidden which you don’t think should be, you can control what Clarity hides or shows by adding HTML attributes to those elements. There’s more detail on how to do that on their help page.
Note that, by way of comparison, HotJar only enabled this kind of ‘masking’ feature by default relatively recently, and much less ‘rigorously’ than Clarity. Clarity has definitely gone to lengths to appear to be privacy-aware; despite storing data and videos of individual user sessions.
If you have concerns around how Clarity collects, stores or hides information, you should definitely explore Clarity’s privacy FAQs. You may also wish to seek legal council based on the particular setup of your own website, tracking, users, and local laws.
It’s open source
Clarity is a very new product, and there’s certainly work to be done before it’s ready for extensive or commercial usage. At the time of writing, there are missing features, ‘coming soon’ notices, and only partial documentation.
But Clarity – or at least the technology which powers it – is open source. You can browse (and contribute to!) the source code at github.com/microsoft/clarity. We’d like to think that this might mean that individuals and organizations who may have felt ‘trapped’ by or into Google Analytics, might come together to bring Clarity up to par.
At the very least, it’ll be interesting to observe the product and its roadmap as it evolves, and to contribute to some of the conversations and decisions around that.
In conclusion
Despite having heavy feature overlap, Clarity is a subtly different product to both Google Analytics and HotJar. It has some of the best features of both, and brings some interesting new metrics to the table.
Given how easy it is to get things up and running, we’d recommend setting up an account and finding out where your site might be causing rage clicks and excessive scrolling.
The only drawbacks we can see at this stage are the lack of ‘comparison’ techniques when exploring the data, and the big privacy questions around whether it’s ‘okay’ to store user behaviour videos at scale.
We’d love to see a version with more controls over video recording (perhaps on an opt-in only basis), which also come with the clever frustration metrics. Maybe we’ll see you over in their open source GitHub code repository, proposing those very controls?
Read more: An introduction to Microsoft Bing Webmaster Tools »

Discussion (4)