Interpreting your A/B test results

We’ve written a few posts on how to set up your A/B tests. However, the setup of your A/B tests is only the first step, obviously. Once you’ve set up a test and you’re getting some results, what should you do then?
In this post I’ll be explaining how you can interpret your A/B test results and what you should look out for.
Test duration
Before you can actually start interpreting your A/B test results, you need to be sure that your test has been running for at least 7 days. This means that you’ll have corrected for the fact that some days get you more traffic, sales or anything else than others.
There are some guides out there telling you to run until your test is at least 95% significant. Marieke has explained to great detail why this is oftentimes not a smart thing to do. Please be aware that this is not a hard requirement to our minds.
Interpreting your results
Sometimes it can be hard to actually know what’s going on when looking at the results of your A/B test. So let me walk you through what I always look at in the results:
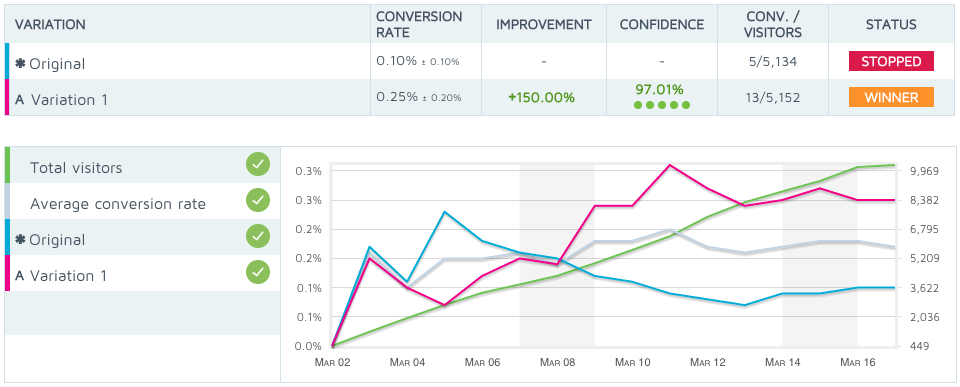
We’re using Convert for our A/B tests, and when a test is done, it will give us a chart that looks something like this one. There’s a lot going on here, which can be quite daunting. First of all, it shows quite clearly that Variation 1 is the winner. However, I’m always very careful when it comes to this. Let me show you why:

This chart shows you that there’s a pretty big jump in the conversion rate, the improvement is 150% and a nice confidence level. However, it also shows us that all this has been calculated over just 18 conversions. Over 10,000 visits, and just 18 conversions. I prefer to have at least 100 conversions on each variation, so this is pretty slim. Now we know that while this result is pretty awesome, we have to be careful in using this data to support any future action.
So, what’s next?
The next thing I’ll check is the graph:
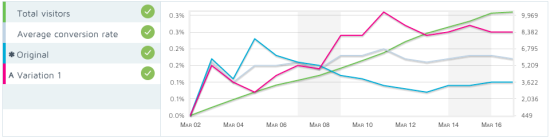
I always take a look at the trend of the test. This graph shows the conversion rate of the original version, the variation, the total visitors and the average conversion rate. The original version (blue line in this case) and the variation (purple line) should not be too close during the duration of the test. If there’s just a spike at the end that made the test variation the winner, you know the results aren’t trustworthy. In this case, it looks pretty good, as the variation outperformed the original pretty soon. But don’t get too ecstatic and stay aware of the low number of actual conversions, in this case.
Be sure you also look at the Y-axis (the vertical one) to make sure the differences aren’t really small. The Y-axis tends to change with results, so small differences can look like big ones.
Other statistics
Convert will give you quite some other statistics that could be interesting and important to look at:
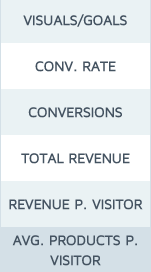
The conversion rate and amount of conversions are obvious ones, but I’m mostly interested in the revenue stats. Which version got you the most total revenue and revenue per visitor? But maybe you’re looking for a higher adoption rate of your product (more people using your product) instead of more revenue. In this case you should look at the bottom one: average products sold per visitor.
These statistics will be available per variation and will give you some detailed information on what the difference between the variations actually was. So be sure to look at these and use them for your interpretation!
Implementing the winning variation
In this case, we have chosen to implement the test variation, but we’ve also kept a close eye on the amount of sales and the revenue. We have checked the amount of sales and revenue against the weeks before, to be sure it wasn’t a fluke during the tests. And I implore you to do the same. It will probably not go wrong a lot, but when it does, you’ll be sorry for it. So stay aware of the fact that these tests are not perfect.
Over to you
Have you ever run a test without knowing what to do with the results? Did you ever make the wrong choice? Or you simply have something to mention about this post? Let me know in the comments!

Discussion (7)